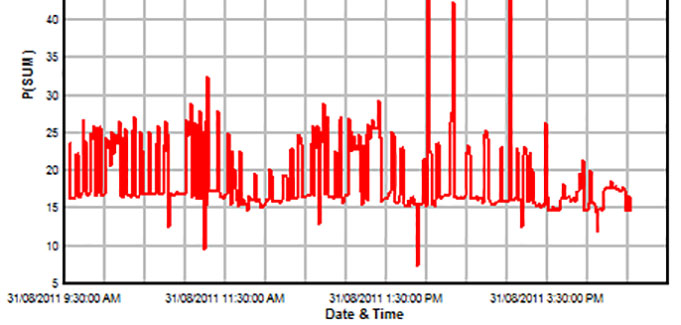
What Is a Load Profile?
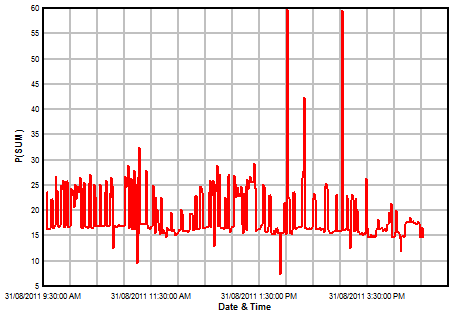
A Load Profile is basically a graph of the electrical load on a system, over time. This can be either single phase or three phase, and could be measured at any point in the electrical system, for example you could profile just a single circuit in a building, or all the circuits used by a tenant, or the whole main feed to a campus. Load profiles are also used by the electricity authorities themselves across sub-networks or entire grids, to help with infrastructure planning.
Why Create a Load Profile?
- to find out the peak demand of a user or building
- to help with planning an upgrade such as a solar installation
- to expose areas or ways in which power is being wasted
- to verify that peak demand-based billing is correct
- to find out how to improve energy efficiency (e.g. to get an improved NABERS rating)
Do you use load profiling for other reasons? Please tell us in the comment section below.
Which Electrical Data Logger Should I Use?
To do load profiling you will need an electrical power data logger, which is an instrument that measures electrical power, and records these measurements to its memory for later downloading and analysis. Instruments can be designed for single phase systems or 3-phase systems. Generally 3-phase instruments can also be used with single phase systems, but not the other way around.
The data logger
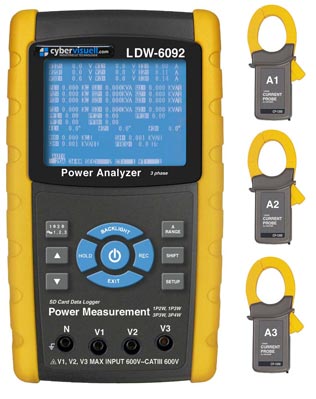
must be able to automatically record the power in kW (kilowatts) at predetermined intervals. It will need to have both voltage and current inputs, in order to correctly calculate the real power. It will also need to take into account power factor in its measurements.
The current will normally be sensed using Current Transformers (CT’s), which could be in various styles including clamp-on, split core, and flexible Rogowski Coil. These will need to be selected according to what you are measuring.
To pick the right CT’s, you will need to check out the physical size and shape of the power cables or bus bars that you need to place these sensors around, and you will also need to find out the approximate maximum power you are expecting to measure. Choose a CT that has a large enough opening (when closed) to fit around the power cable to be measured, and make sure there is enough space to fit it comfortably and safely. The CT must also have a maximum current rating at least as high as the highest current you are expecting to measure.
What Else Do I Need Before Starting?
To install a power data logger like this, a licensed electrician will be required to do the physical installation safely.
Before starting, consider how often the load is likely to change, and decide how often to take measurements. Consider also the reason for doing load profiling. For example if you are profiling the light circuits in an office building for the purposes of upgrading lighting to save power, the load normally only changes when a person switches on or off a light, so you might only want to measure it every 15 minutes to half an hour. In other cases the load could be changing drastically from minute to minute so you might choose an interval of 30 seconds to capture all the detail. In extreme cases you might even choose an interval as short as 2 seconds, but be aware that this kind of interval will result in a huge amount of data to be processed afterwards.
Some 3 phase data loggers will also require a GPO (General Purpose Outlet, or power point) to power the logger. If this is not available in the switch box, you might need to arrange a temporary extension lead or have a GPO socket installed by your electrician.
How to Set Up The 3 Phase Data Logger
For the CyberVisuell LDW-609x range of 3 phase data loggers, please refer to this blog article for detailed instructions on how to prepare and set up the data logger.
For other brands of data logger, some of these steps will be relevant but you will need to consult the instructions for the data logger as well.
How to Get a Graph of the Load Profile
For the CyberVisuell LDW-609x range of power data loggers, each logger is shipped with a copy of DPlot software for graphing the recorded data. Power off the logger, remove the SD memory card from the logger, and connect the memory card to your PC using the USB-SD card adaptor supplied.
It is recommended that you first make a backup copy of the data files from the SD card, in case anything accidentally gets deleted.
Now run DPlot (assuming you have already installed it), and open the file using “Option D: Multiple columns 2D, eg. CSV files”.
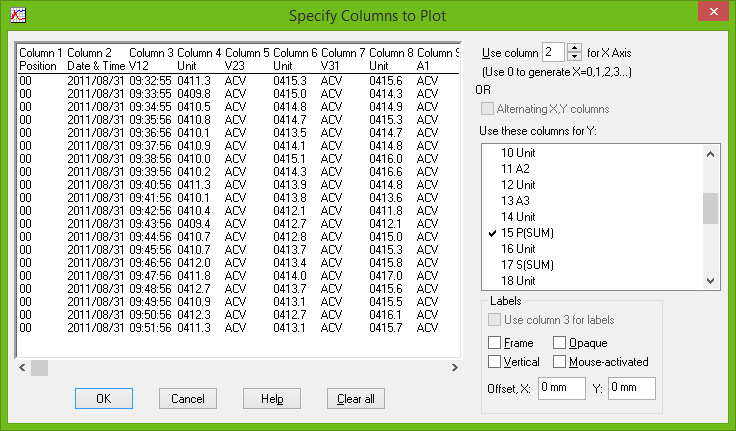
Select Column 2 to be the X axis (date & time), and untick all the columns for Y. Now tick the “P(SUM)” column if you were measuring a 3 phase system, this is the total power consumed by the system. This should result in a graph of the power usage (kWh) versus time.
If you are using a different brand of 3 phase data logger, consult the instructions for how to use the software to download the data and generate a graph of power versus time.